
[Statistics] All Countries Markets Analysis Week 13
Day 1,598, 02:32
•
Published in Portugal  •
by
•
by
 •
by
•
by jotapelx

Hello,
Today I'm finishing the analysis for this week series with the market ranking. After the series of data from the marker-watch I was able to gather some consistent information regarding our markets, by country and from that I can extrapolate to the Alliances. I've tried to retrieve the data everyday at around 2:00 (eRepublik Time). Sometimes it was a bit earlier, and sometimes a bit later (it is dependent of my RL work).
We will look into the Market Ranking by country. We will look into the average best prices for each Alliance and Big Alliance. And in the end we will look into the evolution of those prices by each Alliance. All values are net without VAT, or income tax for the jobs market.
Since the countries in each alliance are not really homogeneous I've tried to create a more meaningful aggregation by population size:
-Large Countries with an Active Population bigger than 4000;
-Medium Countries with an Active Population between 1000 and 4000;
-Small Countries with an Active Population lower than 1000
With that aggregation I'm able to actually make more meaningful comparisons, and since I'm Portuguese, I'll compare the evolution of prices for Portugal, Germany, France and Ireland (the eRepublik Commonwealth, not the RL one), the good thing of this comparison is that you have France as a Large Country, Portugal and Germany as a Medium Country and Ireland as a Small Country, which allows us a better reading of the data. If you wish your country to be part of this ranking, let me know and I'll try to add a new article with those timelines (depending on the number of requests, of course)
The baseline data of these statistics is from day 1594, 03:00. But the markets data is from day 1588 until day 1595 at around 2:00 (eRepublik Time)

The ranking is described in this article http://www.erepublik.com/en/article/-statistics-country-markets-analysis-week-12-1994779/1/20
[Edited] Import Weapons tax fixed.


In the next charts we will look into the data by each Alliance and by Country Size for each market.

The following chart is the average value for each alliance concerning Food Raw Material:
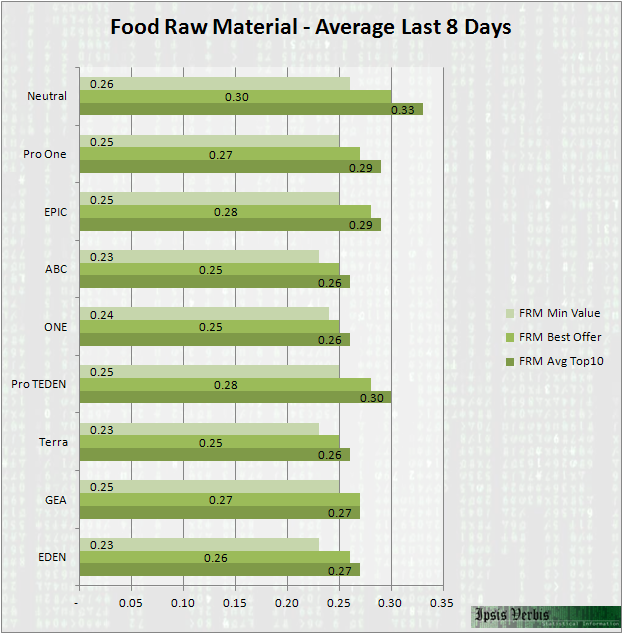
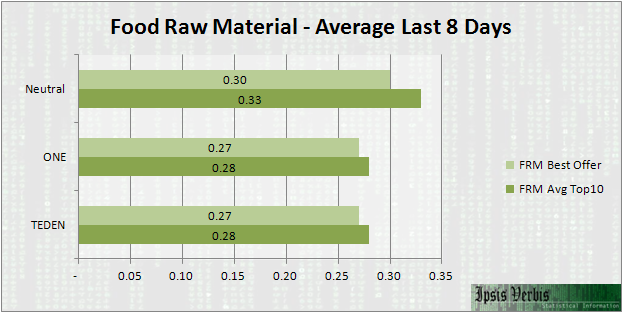
By Big Alliances we have:
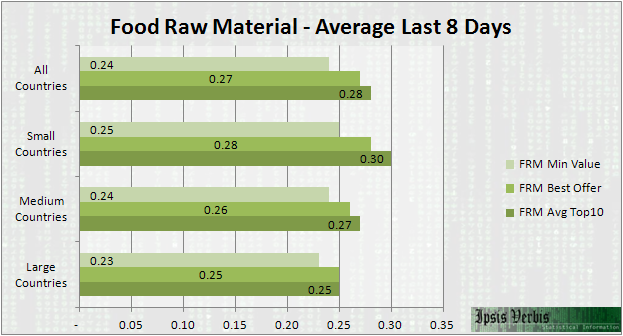
By Size we have:
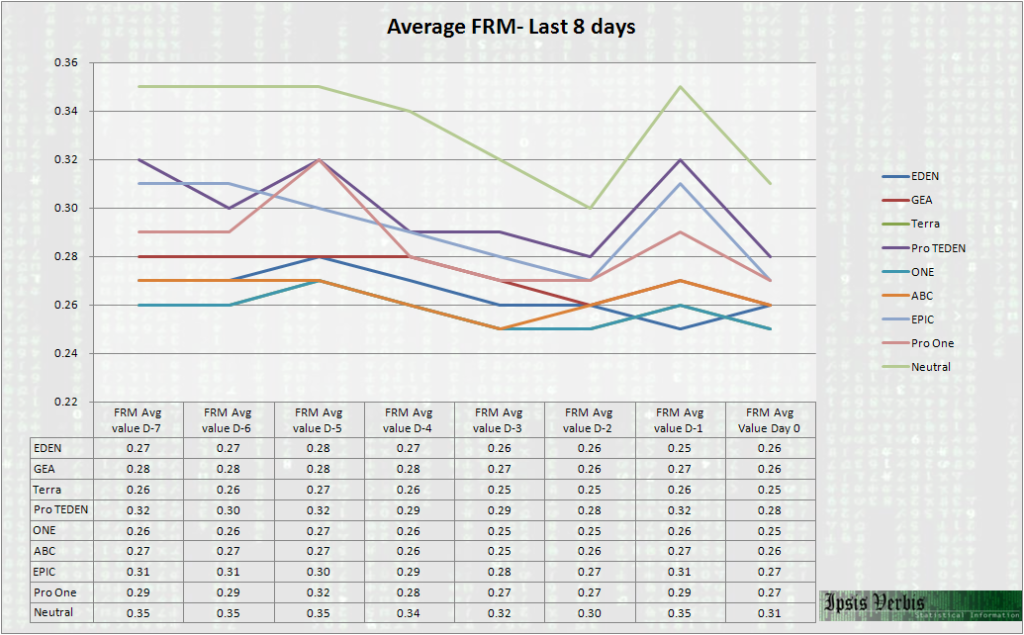
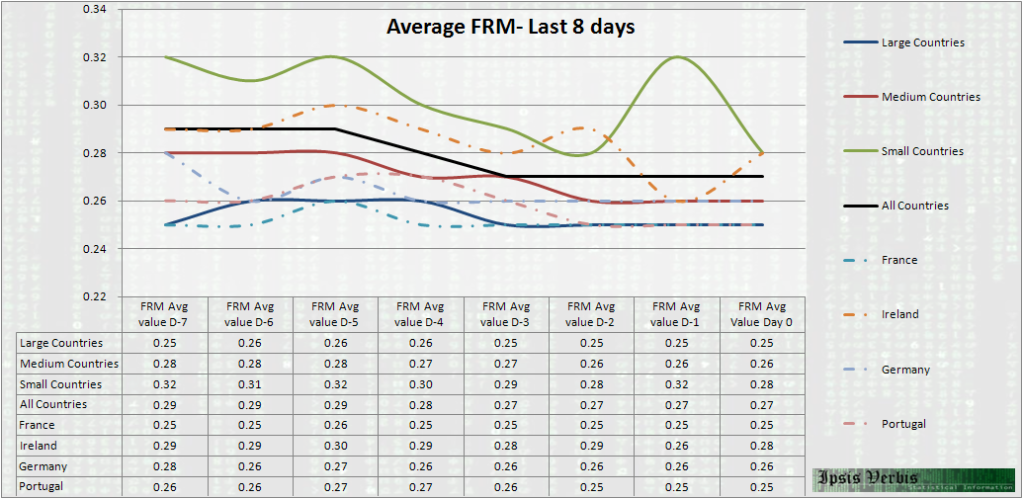
The timeline evolution of prices for each Alliance:
The timeline evolution of prices aggregated by Country Size and the Commonwealth Countries in the backgroun
😛

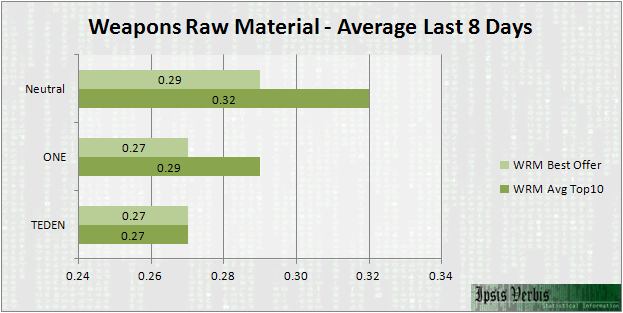
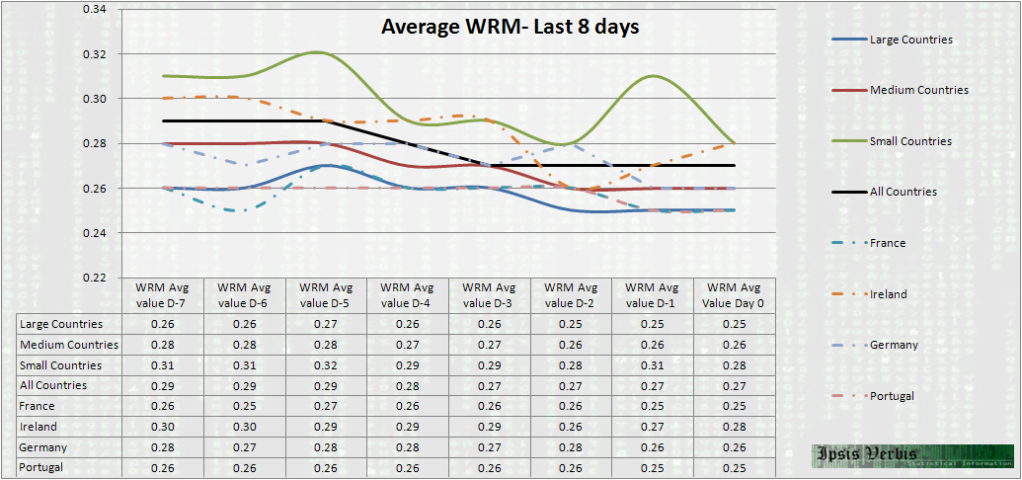
The following chart is the average value for each alliance concerning Weapons Raw Material:
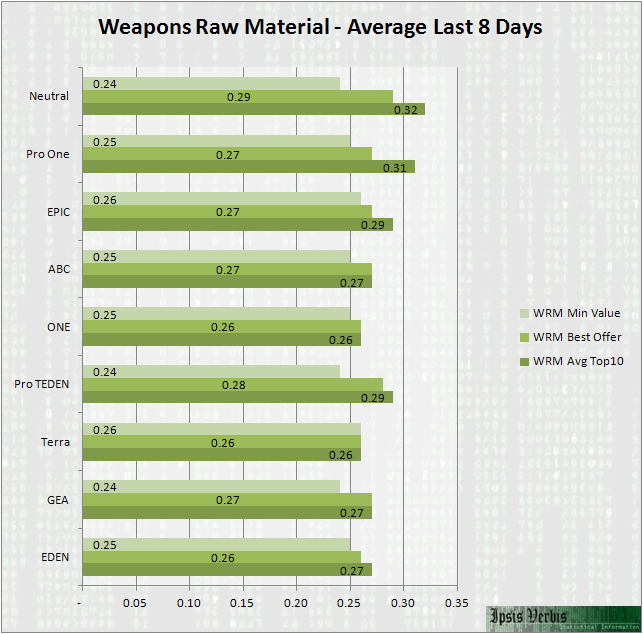
By Big Alliances we have:
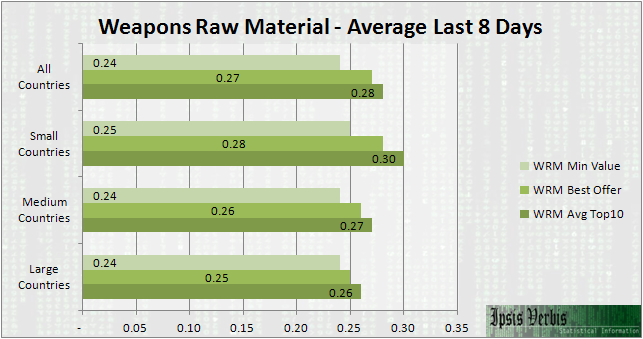
By Size we have:
The timeline evolution of prices for each Alliance:
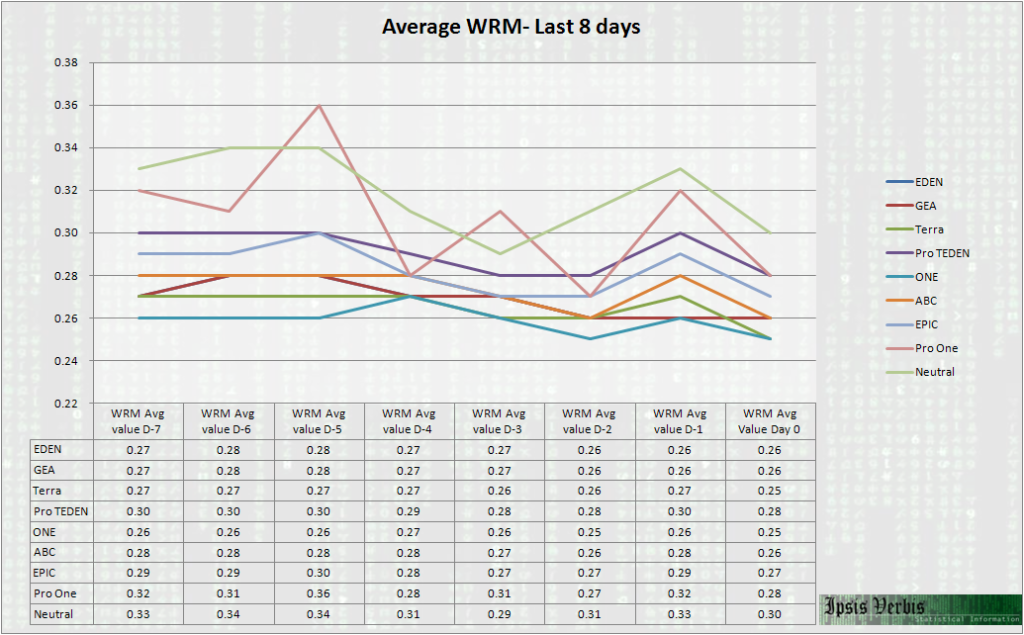
The timeline evolution of prices aggregated by Country Size and the Commonwealth Countries in the backgroun
😛

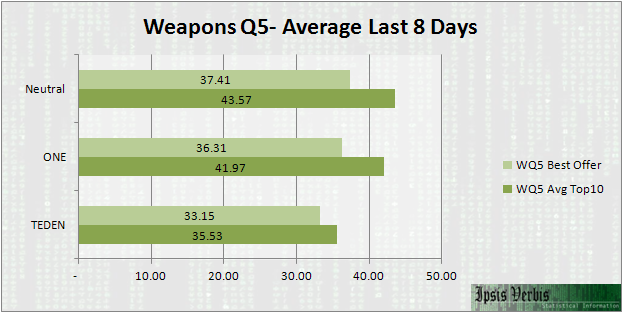
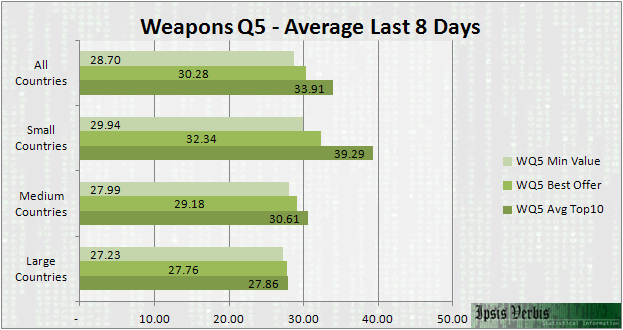
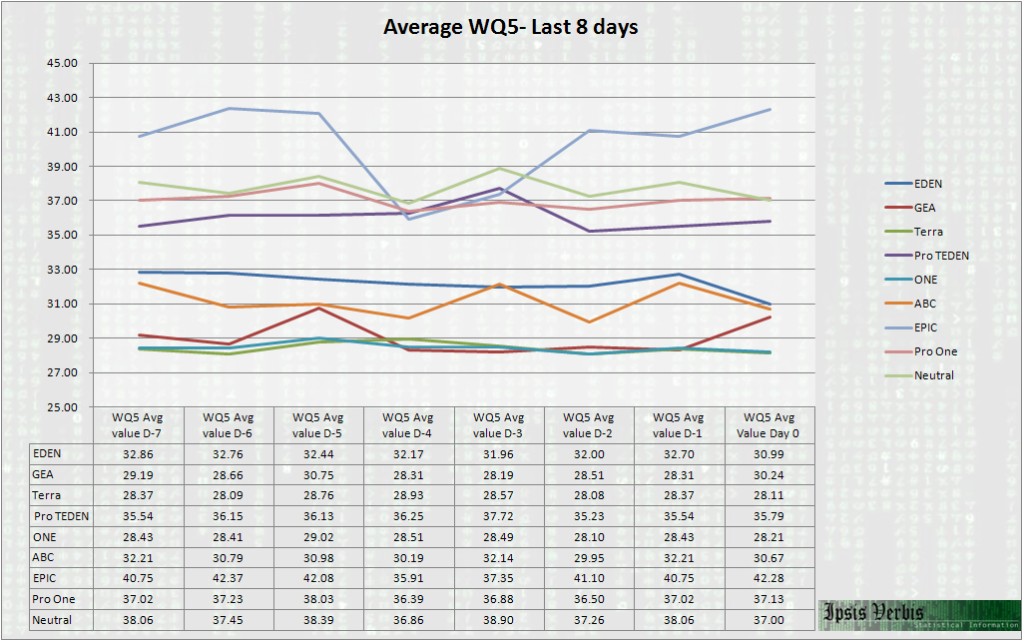
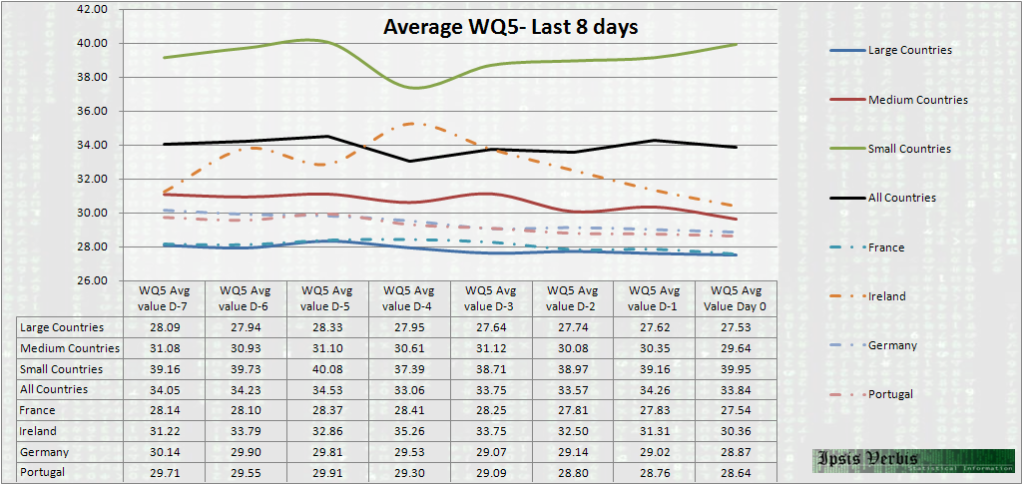
The following chart is the average value for each alliance concerning Weapons Q5:
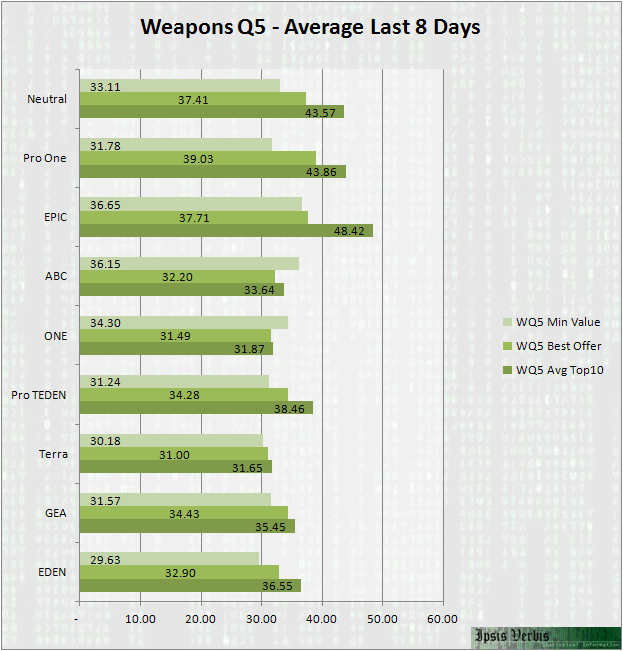
By Big Alliances we have:
By Size we have:
The timeline evolution of prices for each Alliance:
The timeline evolution of prices aggregated by Country Size and the Commonwealth Countries in the backgroun
😛

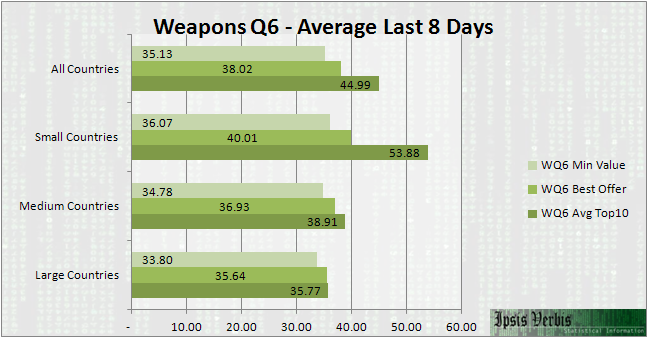
The following chart is the average value for each alliance concerning Weapons Q6:
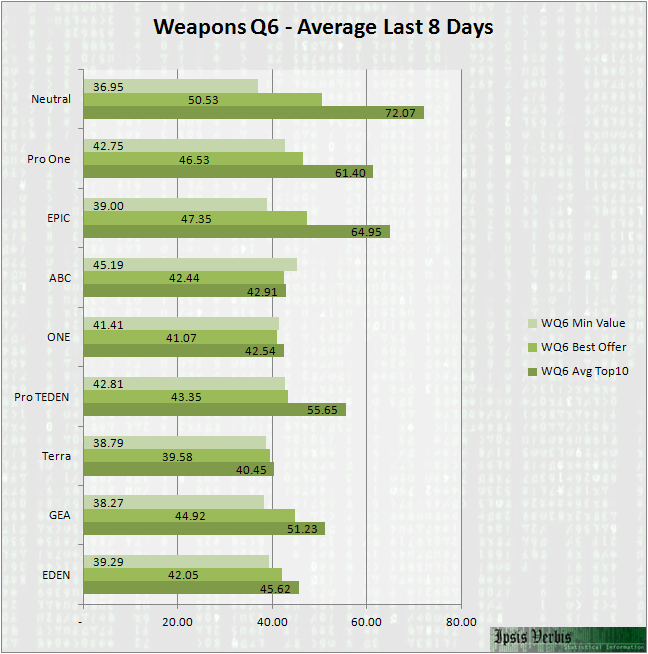
By Big Alliances we have:
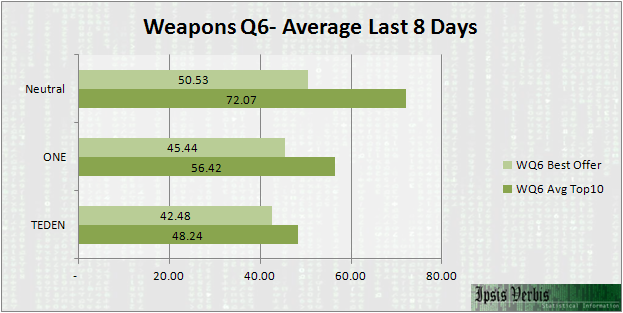
By Size we have:
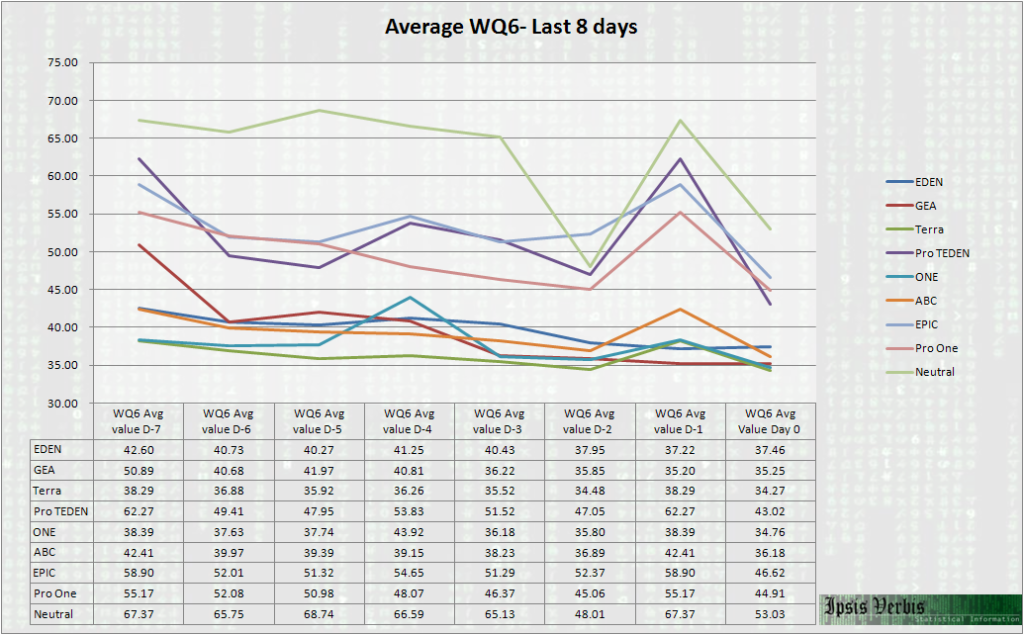
The timeline evolution of prices for each Alliance:
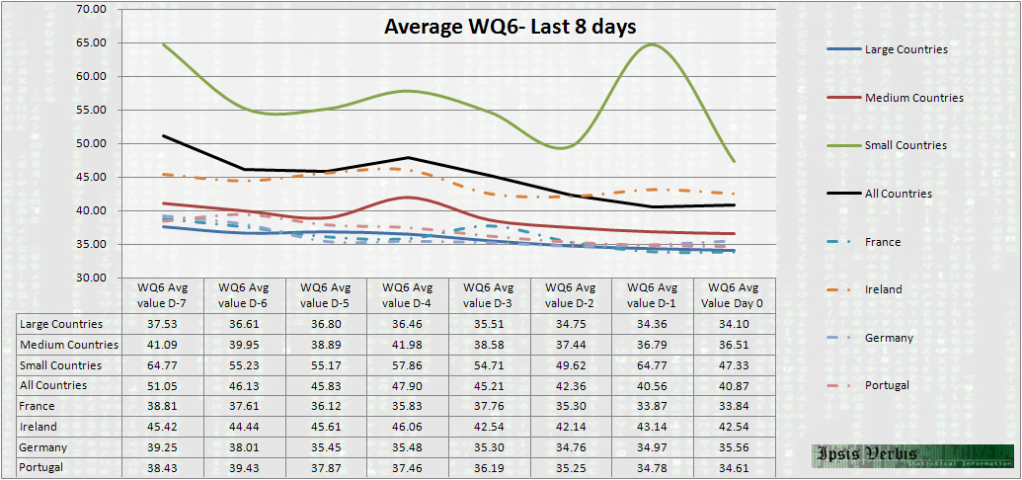
The timeline evolution of prices aggregated by Country Size and the Commonwealth Countries in the backgroun
😛

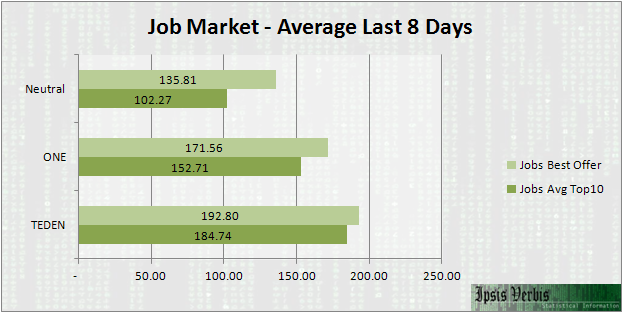
The following chart is the average value for each alliance concerning Jobs Salary:
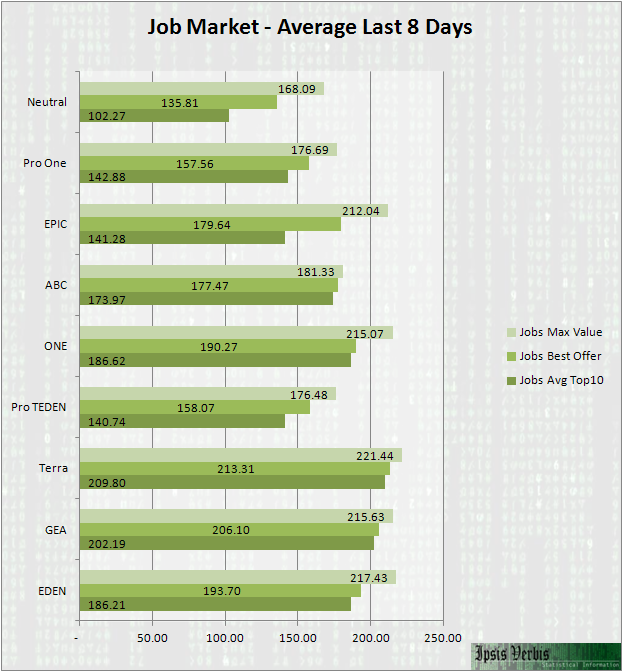
By Big Alliances we have:
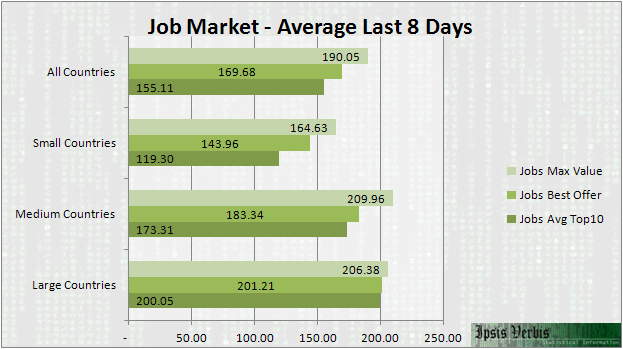
By Size we have:
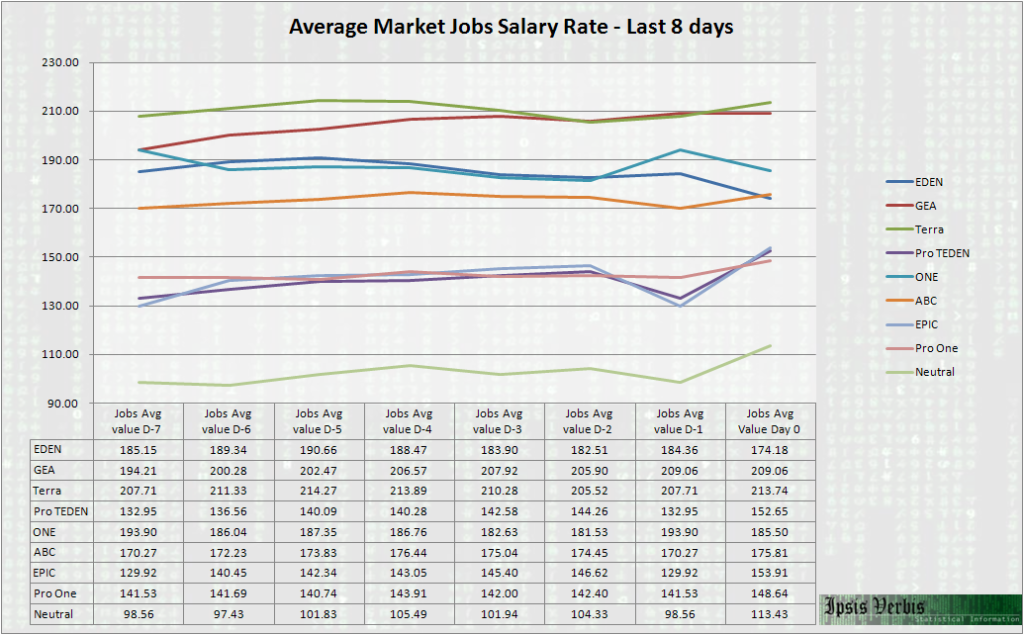
The timeline evolution of prices for each Alliance:
The timeline evolution of prices aggregated by Country Size and the Commonwealth Countries in the backgroun
😛

And that's it for this week analysis. The next articles will be related with the Presidential Elections, and a comparison between taxes around the eWorld.
As always, in order for this information to reach a wider audience, please vote, subscribe and shout this article.
Best Regards,
jotapelx
PS: I'm proud to say that this newspaper has a Hungarian translation in http://www.erepublik.com/en/article/kongresszusi-statisztik-aacute-k-1980790/1/20
and a Chinese translation in http://www.erepublik.com/en/article/-no-4-1-1988582/1/20 .


Comments
V
Great job !
I would like to point out to my countrymen, the evolution of the salary rate of Portugal. Also, notice the price of the Q5, and Weapons Raw. It's almost not worthy to have employees in Q5 Factories.
Good stuff!
Crazy job market and Q5 are almost dead...
Well done!
Vote and Sub.
The best financial statistics newspaper in the world right now.
great!
The best financial statistics newspaper in the world right now. x2
The best financial statistics newspaper in the world right now. x2
o7 to all the work!
Excellent work, mate! I am shouting this in Macedonia!
Cheers & keep up the good work!
sub 382 & friend request.
there is too much awesomeness in this article to break it down into points... it's simply, AWESOME \o/
OMG!! this is a great job !! people must vote !! oO
Great Article V+S
regards from macedonia
Great work. Your weapons import taxes are wrong though.
This is superb.
good work
@Dan Moir: You are absolutely right, I was pointing to the wrong column. I'll fix it.
V
Great job !
Wow! Epic analysis!
v
v+
good work
V
WOW! Put your work in something more useful and meaningful. Not in Plato's shit..
great work
V + S
Y U NO HAVE MM ?
okumaya erindim adam bi de hesaplamış o kadar şeyi
kimin çocuğuysa yazık lan. böyle işlerle uğraşıyor.
neyse moralini bozmayalım.
voted.
v+s
good work
v+s
Excelente!
Votado!!
nice work. voted and sub from member of İNCİ😃
Vote, sub!
Good article!
v
The best financial statistics newspaper in the world right now. x3
Although it would be cooler if your country gave Venezuela's lands back =3
good job, v+s
v 189 s 460
v+s!
ben bunu okucak adam olsam mezun olur işe başlardım
Great job, but what you missing is the analysis. Charts and graphs are nice, but where is the conclusion? Keep up the good work.
V+S
Top notch article, shouted in Ireland.
V+S
Gj
O_o
V+S! Give this guy a MM for the work he put in. Outstanding.
There is a lot of useful data here, however the rankings is very flawed as it uses random statistical values to evaluate the data.
Using an average of the top 10 offers might prove correct in highly active markets, but will not be so in smaller countries. On the other hand the role of the bot in bigger countries will cause the more active players to place their offers at higher prices and not be present in the top 10 offers.
A way to measure economic strength is to measure amount of tanks on market per active players, which will show level of supply of an economy. This statistic can be ranked easily without introducing an inordinately big statistical error.
v-s
Also better way to measure resource markets is to take quantity of resources offered at different prices and measuring their weight in a normal bell curve. Assigning weight to each value and calculating a medium can give a value for comparison as well, however I doubt there will be any useful variance because of the universal monetary system, which is making prices of resources where there are no taxes, the same everywhere with small fluctuations mostly based on player activity.
great job
great job, congrats!
reminds me of an article I wrote months ago!
s502 gj