
Grain Price Data Since Late September
 •
by
•
by Heero Blaze
With the decline in grain and food prices, I thought I'd share some data I have from my own company, Blaze Barley (a grain company). I've kept track of all my product sold since I opened my company and have a nice little graph to share with everyone. This is in part to respond to the issue raised by Congressman princefigs here.
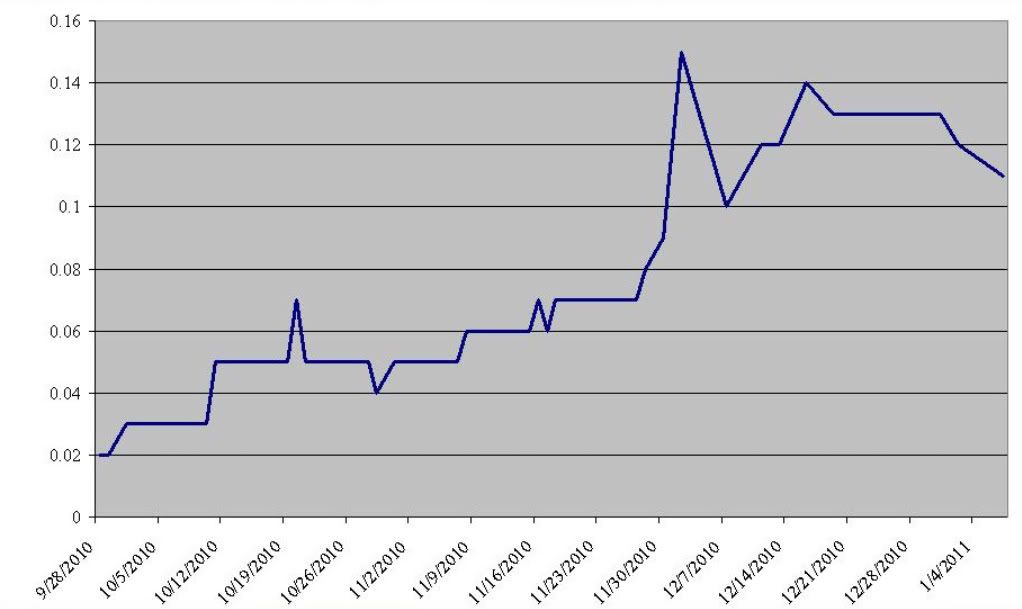
The graph includes 66 instances of product being sold and I always sold at the current market value. The numbers are not adjusted in any way. As the graph demonstrates, grain had a steady rise in price for sometime before a drastic increase which peaked on December 2nd when it reached .15 USD, declined, and peaked at .14 USD on December 16th and then begun to decline once more. Unfortunately, I have no data regarding food prices to establish a correlation, but I'm sure there are economists out there that might want to compare their data to what is seen here. Of course, the data used for the graph are available upon request. Where the market goes from here will be interesting.
Heero Blaze
CEO of Blaze Barley
Interested in joining Blaze Barley? click here
Comments
Thanks, it will be useful. (smiley)
thanks
You should add a mark when the admins decided to cut productivity in half at RM companies
Price stabilization is the essence of a sound agricultural program. Of course neanderthals like Tango and Feinman couldn't get it into their heads. They could at least offer some loans to businesses in danger with the money they stole from t'jelle.
I had thought about adding key events to the graph like the adjustment of productivity formulas, key battles, and Operation Monkey Business to see how those may have affected prices, but was lazy. Maybe I'll look into it and update this graph later.